FEATURED ARTICLE
How to Make the Best Decision Every Time: Using Data to Manage Your Business
In a competitive market where agility, flexibility, and quick decision-making are critical, timely and accurate data analysis is more important than ever. Read about business intelligence and how companies in the energy industry are using it below, or watch our presentation above from the Eastern Energy Expo.
What is Business Intelligence?
Business intelligence is the result of collecting, analyzing, and presenting your business data in a way that’s easy to understand. Business intelligence is:
- Visual, so you can quickly and easily process and understand the information in front of you.
- At-a-glance, so you can gain insights instantly instead of spending hours reading reports.
- Real-time, so you’re always working from the most current data, not last month’s or last quarter’s.
- Deep, with drill-down capabilities so you can dig into the details when you need to.
Business intelligence also refers to the tools that support this process.
How Companies Use Business Intelligence
Evaluate performance. Companies use business intelligence to track and evaluate their key performance indicators, like sales by product or location or profitability by customer or contract.
Track progress against goals. Today, organizations are engaging and motivating their workforce by setting goals and giving employees access to the data they need to track their progress.
Identify and correct problems. Business intelligence helps you spot and correct problems before they’ve had the chance to negatively impact your business. For example, identifying tanks that consistently have suboptimal drops or accounts with low margins.
Identify and track trends over time. Business intelligence gives you a more visual way to analyze year-over-year results, seasonal trends, return on investments or assets, and customer retention.
Strategic decision-making. When you have a way to bring together all of the information across your organization and analyze it effectively, it becomes easy to answer strategic questions with confidence.
By using business intelligence for these purposes, your organization gains a competitive advantage. Compared to other companies, you’ll understand your business better, have an engaged and motivated team, be poised to take corrective action sooner, be equipped to make more accurate predictions, and be able to make strategic decisions quicker and jump on new opportunities faster.
Top BI Metrics for Fuel Dealers
You determine the key performance indicators for your business based on what’s important to you, but here are some of the top metrics tracked by fuel dealers responding to our Tech Trends Benchmarking Survey:
• Margin by gallon/product/customer
• Gallons per mile/per hour
• Runouts
• Stops made or missed in geographic location
• New accounts added vs. lost (churn rate)
• Cash flow/balance sheet
• Forecasts (including cash flow)
• Budget plans
• Gallons per degree day (normalized for weather)
• Gross profit per hour (service)

Types of BI Tools
Business intelligence tools come in different forms with a range of functionality and flexibility.
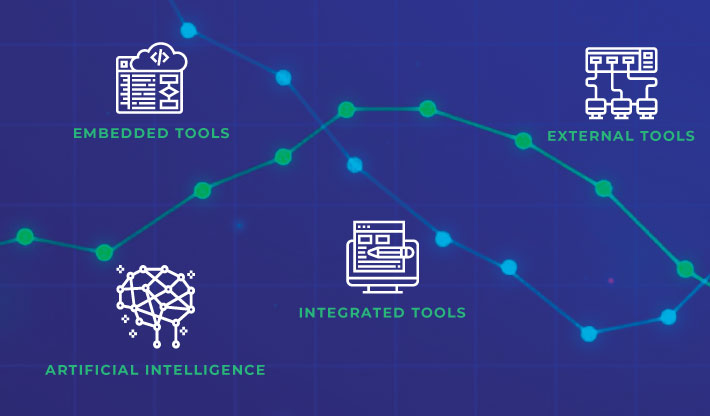
Embedded tools. Many of the software products you use will have some form of business intelligence embedded directly in the system. For example, dashboards or reports in your fuel delivery or operational software.
Integrated tools. If you use multiple systems to manage your business, you may be able to take advantage of integration (syncing two software products) to consolidate your data. For example, if your accounting software has more robust reporting tools, you may send information from your fuel delivery software to your accounting system for analysis.
External tools. When consolidating your data through integration is not possible or becomes too complex, you may be ready for a standalone business intelligence tool like Microsoft Power BI. Business intelligence products are designed to consolidate multiple data sources so instead of pulling information from multiple systems, you have one place to go for reporting, dashboarding, and data analysis.
Developing Your Reporting & BI Strategy
Many organizations see the value of business intelligence but aren’t sure how to get started. As a software provider in the industry, here are our recommendations.
Start with the data you want to see. What metrics do you want or need to track for your business?
Figure out how to get it. What software or business systems have the information you need? Can you easily get the data out of those programs? Do they already have tools built in to help you analyze the data? If not, can you send the information to another program with better BI capabilities? Do you need an external BI tool to gather data from multiple systems?
Decide how often you want to see it. Set up dashboards or visualizations for your most critical information that needs to be reviewed frequently. Create reports for information you want to review regularly, like weekly or monthly.
Test and refine. Is data being entered into your systems fast enough so you have the most current information? Are the reports and dashboards you created delivering the insights you need and expect? Have they uncovered other questions that you’d like to answer?
Cargas Energy & Business Intelligence
No matter what information you use for your business, finding a way to make it easier and faster to understand can only help you. Cargas Energy’s fuel delivery software has everything you need to quickly and easily analyze your business data, including a query tool and advanced reporting and dashboard capabilities. Contact us to learn more about what your team can accomplish with Cargas Energy.